
Source: André Luiz D. Takahashi | ASCOM via Flickr.
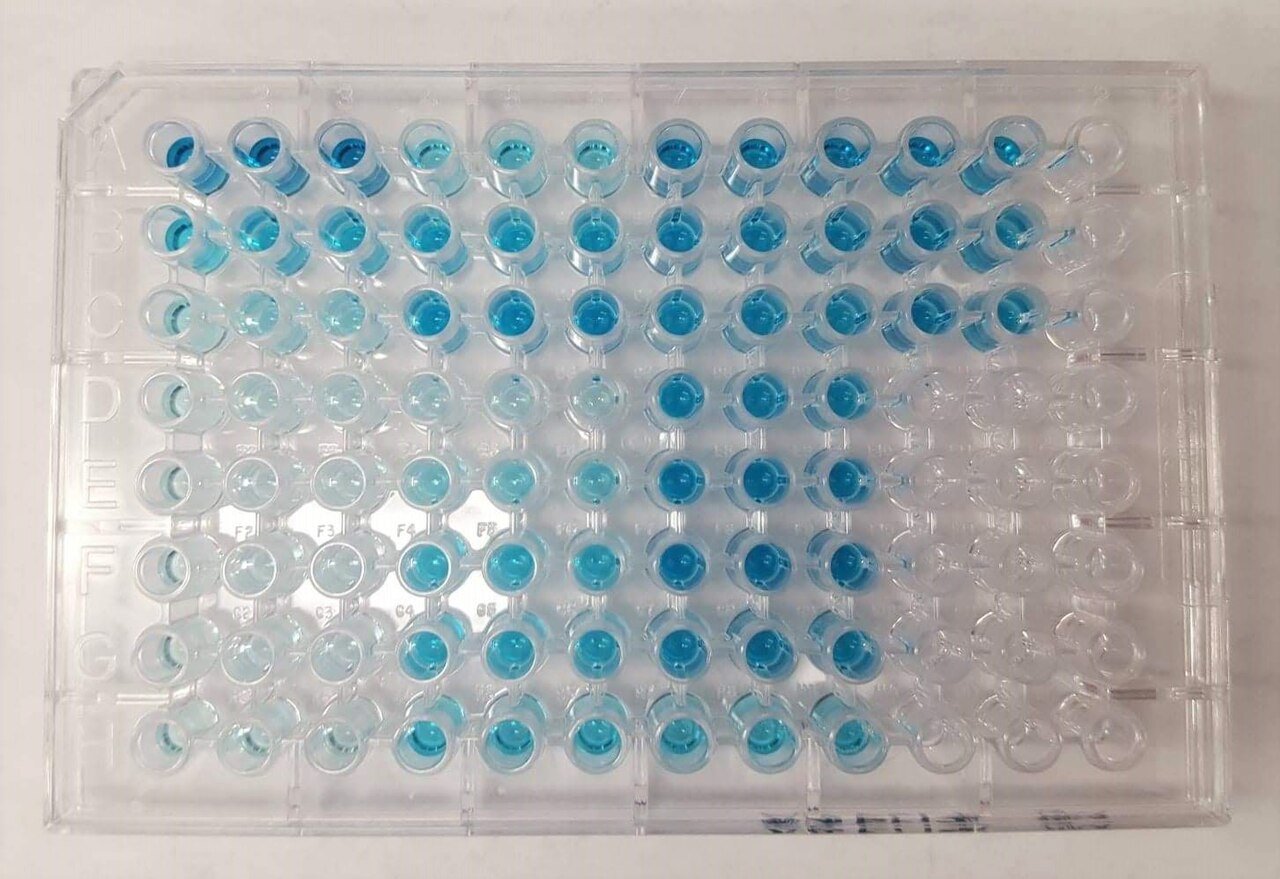
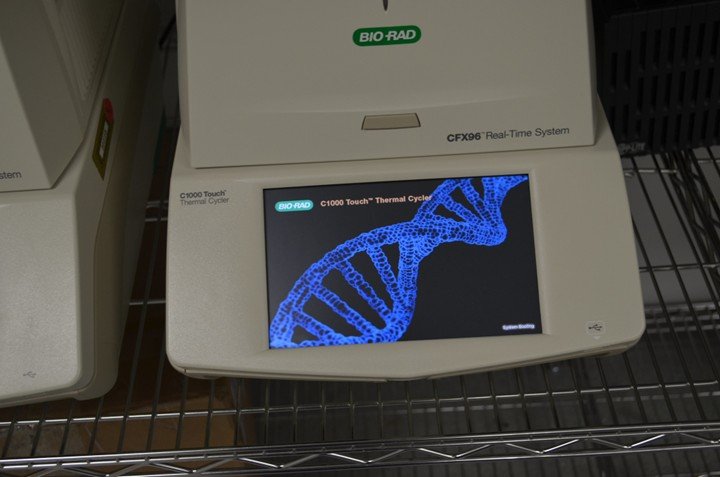
In the lab, I’ve learned that the more data I generate, the more sophisticated the analysis needs to be. Whether it’s running regression models or interpreting RNA-seq results, statistical tools help me find the signal buried inside a flood of numbers. They’re what turn raw experiments into meaningful conclusions.
But that’s when I’m studying cells under controlled conditions. Now imagine stepping outside the cell and into the real world.
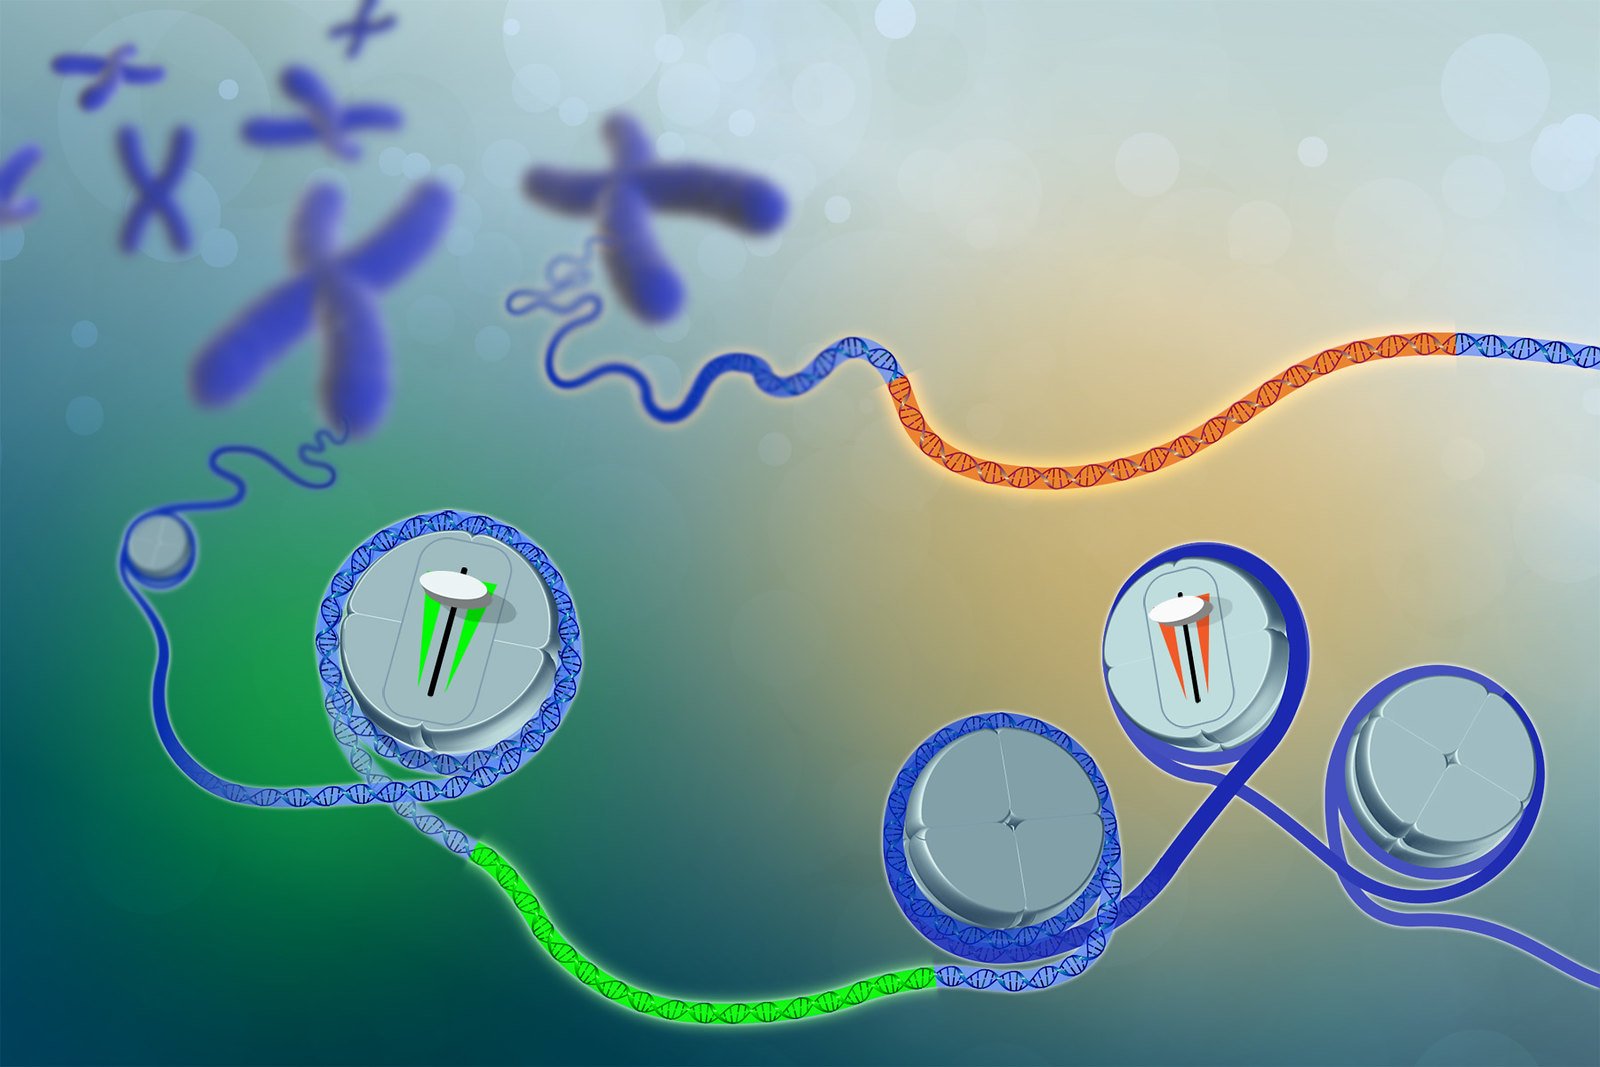
Instead of one variable, there are dozens: climate, urban density, sanitation, mosquito ecology, and human movement patterns, all shaping what happens inside Aedes mosquitoes and influencing how viruses like dengue, Zika, or chikungunya spread.
When disease transmission depends on multiple places, times, and interacting factors, simple case counts aren’t enough. Scientists need tools that can detect patterns across geography and time simultaneously.
This is where scan statistics become essential. These methods help epidemiologists answer a core public-health question: Is disease appearing in a place or time more often than we would expect by chance?
Two main approaches are used to answer that question, univariate scans and multivariate scans, and the difference between them reflects two very practical ways of understanding outbreaks.
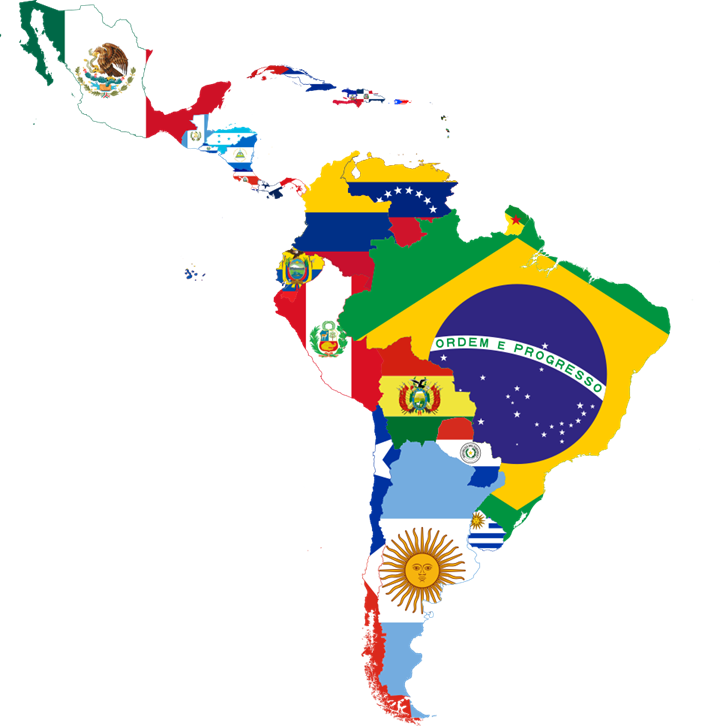
Many studies highlighted on Pathogenos rely on scan statistics to produce data that drives public health action in Latin America and worldwide. Here’s what scan statistics are and why they matter.
What Scan Statistics Do: How They Detect Disease Clusters in Public Health

Source: Blondinrikard Fröberg from Göteborg, Sweden via Wikimedia Commons.
At its core, a scan statistic works like a moving spotlight over a map.
Imagine placing a circular window over one city, then slowly expanding it to include neighboring areas, and then shifting that window across the country. At each position, the method compares the number of observed cases inside the window to how many would normally be expected based on population size and background risk.
If the number is unusually high, the area is flagged as a potential outbreak cluster.
When time is included, that window becomes a cylinder.
The base represents geography, and the height represents time. This allows scientists to detect clusters that are both localized and concentrated within a specific time period.
Instead of guessing whether a surge is meaningful, scan statistics provide a statistical test that separates real signals from random fluctuations.
But how this method is used depends on whether researchers are tracking one disease or several at once.
Univariate Scans: Detecting One Disease at a Time
A univariate scan analyzes a single outcome variable, usually one disease or one dataset.
In practice, researchers input case counts for one infection across regions and time periods. The model then scans across space and time looking for areas where that disease occurs more frequently than expected.
For example, if scientists want to know where dengue transmission intensified during a particular year, a univariate scan can identify municipalities with statistically significant excess cases compared to their population and historical baseline.
Because the method accounts for expected incidence, it can distinguish true outbreak signals from normal seasonal patterns.
This approach answers a focused question: Where is this specific disease clustering right now?
Univariate scans are widely used for early outbreak detection, routine surveillance, and evaluating whether interventions are working. They are especially powerful when tracking a single pathogen over long periods.
But real-world outbreaks rarely involve only one disease.
Multivariate Scans: Detecting Co-Occurring Diseases
A multivariate scan extends the same logic but analyzes multiple datasets at the same time.
Instead of testing one disease, it evaluates whether two or more diseases are clustering together in the same place and time.
This is especially important for arboviruses like dengue, Zika, and chikungunya, which share the same mosquito vector and often respond to the same environmental conditions.
Methodologically, the process still uses a moving scanning window across space and time. But instead of comparing observed versus expected counts for one disease, the model evaluates whether the combined pattern across several diseases deviates from what would normally be expected.
This allows researchers to detect shared transmission environments driven by factors such as climate, mobility, or vector abundance.
In other words, a multivariate scan answers a broader question: Are multiple diseases rising together in the same place and time?
Why the Difference Matters for Public Health
Source: Henrykez via Wikimedia Commons.
Understanding this distinction changes how we interpret outbreak data.
Univariate scans help identify where one pathogen is intensifying. They are ideal for tracking a specific disease, measuring the impact of interventions, and detecting early signals of resurgence.
Multivariate scans reveal something different: transmission ecosystems. They show where multiple health threats are emerging together, helping public-health teams design integrated responses rather than pathogen-by-pathogen strategies.
For regions like Latin America, where arboviruses frequently co-circulate, this distinction is critical. Surveillance systems that only track one disease at a time may miss the broader environmental signals driving transmission.
From Bench Science to Outbreak Intelligence
In the lab, statistical tools help us interpret complex datasets from a single experiment. At the population level, scan statistics serve a similar role, they turn massive surveillance datasets into actionable insight.
Univariate scans show where one disease is intensifying. Multivariate scans reveal when multiple threats share the same landscape.
Together, they help epidemiologists move from counting cases to understanding transmission systems.
At Pathogenos, that’s the real goal of translating outbreak science: not just explaining how pathogens spread, but showing how researchers uncover the patterns that shape epidemics in the first place.
Stay informed. Stay prepared.
Subscribe to Pathogenos for clear, evidence-based insights on infectious diseases shaping Latin America and the world, delivered in plain language for scientists, students, and public-health professionals.
