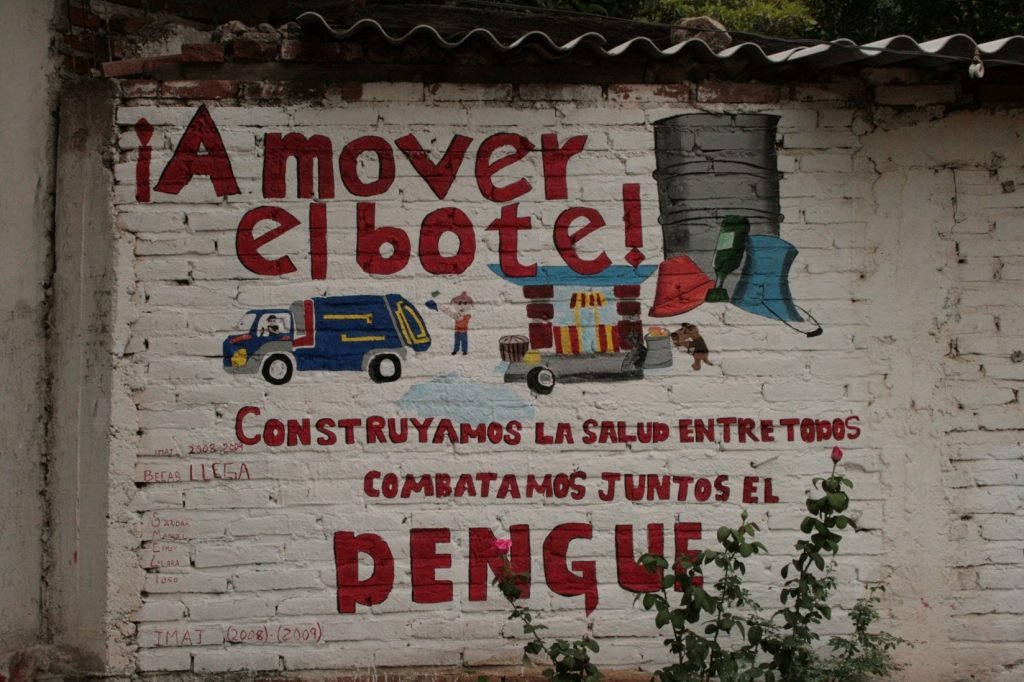
Figure 1. Anti-dengue campaign in Autlán, Mexico. Source: perliux via Flickr.
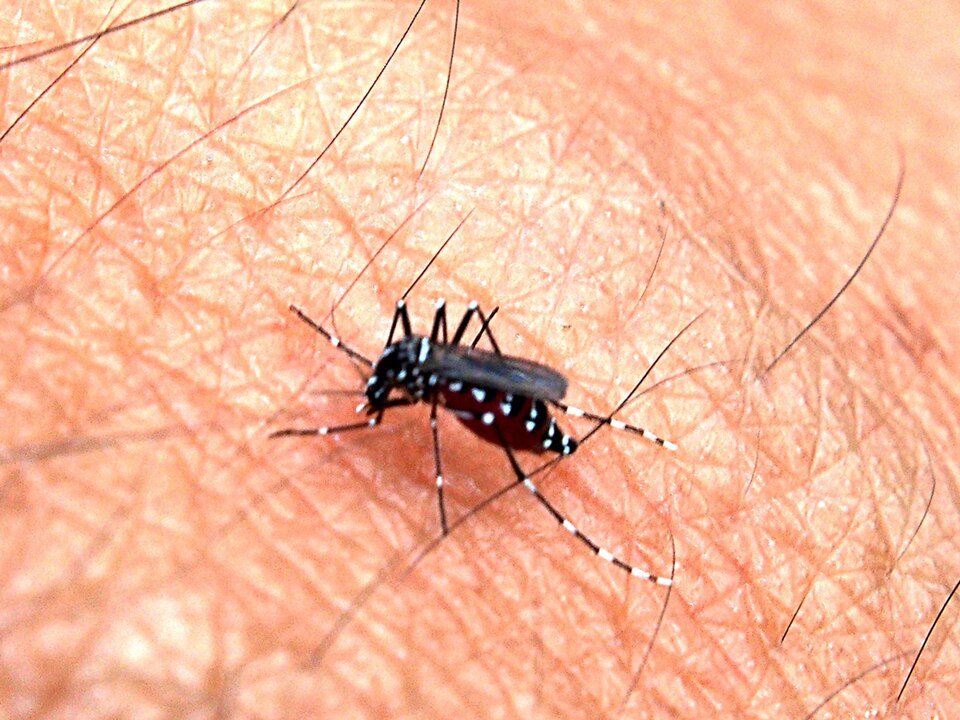
Like Colombia and other Latin American countries, Mexico has faced growing threats from Aedes aegypti– borne viruses such as dengue, chikungunya, and Zika.
Statistically speaking, dengue cases surged by 385 % in Mexico during epidemiological week 24 of 2024. Shockingly, 59% of these cases were concentrated in just five states: Guerrero, Tabasco, Veracruz, Michoacán, and Chiapas.
These are extremely worrying numbers as dengue cases in 2024 exceeded the number of cases historically reported compared to previous recorded years. How much more will they rise in years to come?
When it comes down to fighting these viruses, the best approach has been to control the vehicle they use to infect humans: the mosquito.
However, conventional mosquito control strategies often involve widespread, citywide spraying efforts that can overextend public health resources without delivering proportionate results.
A recent spatial analysis study performed by Dzul-Manzanilla et al. published in The Lancet Planetary Health in 2024 offers a more precise approach. Through spatial analysis of arbovirus transmission, the study highlights how hotspot mapping can improve vector control by identifying high-risk zones.
This method helps public health programs in Mexico and across Latin America to focus efforts where they are needed most, optimizing resource allocation and potentially saving more lives.
Hotspot Mapping: How Spatial Analysis Is Transforming Dengue Surveillance
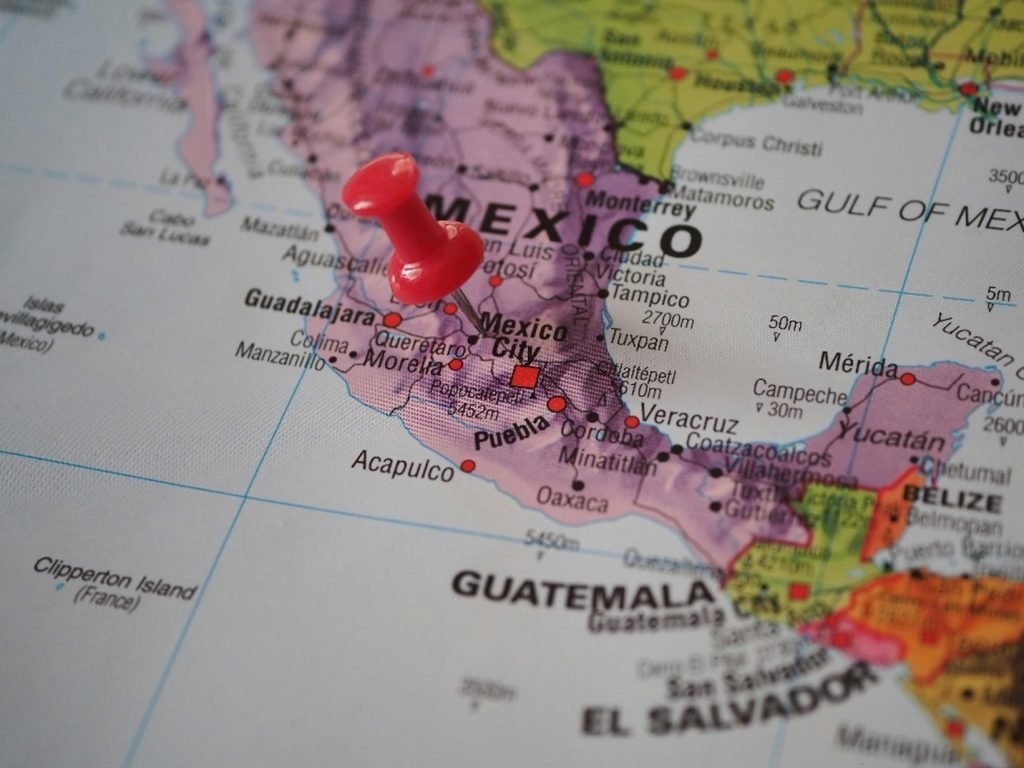
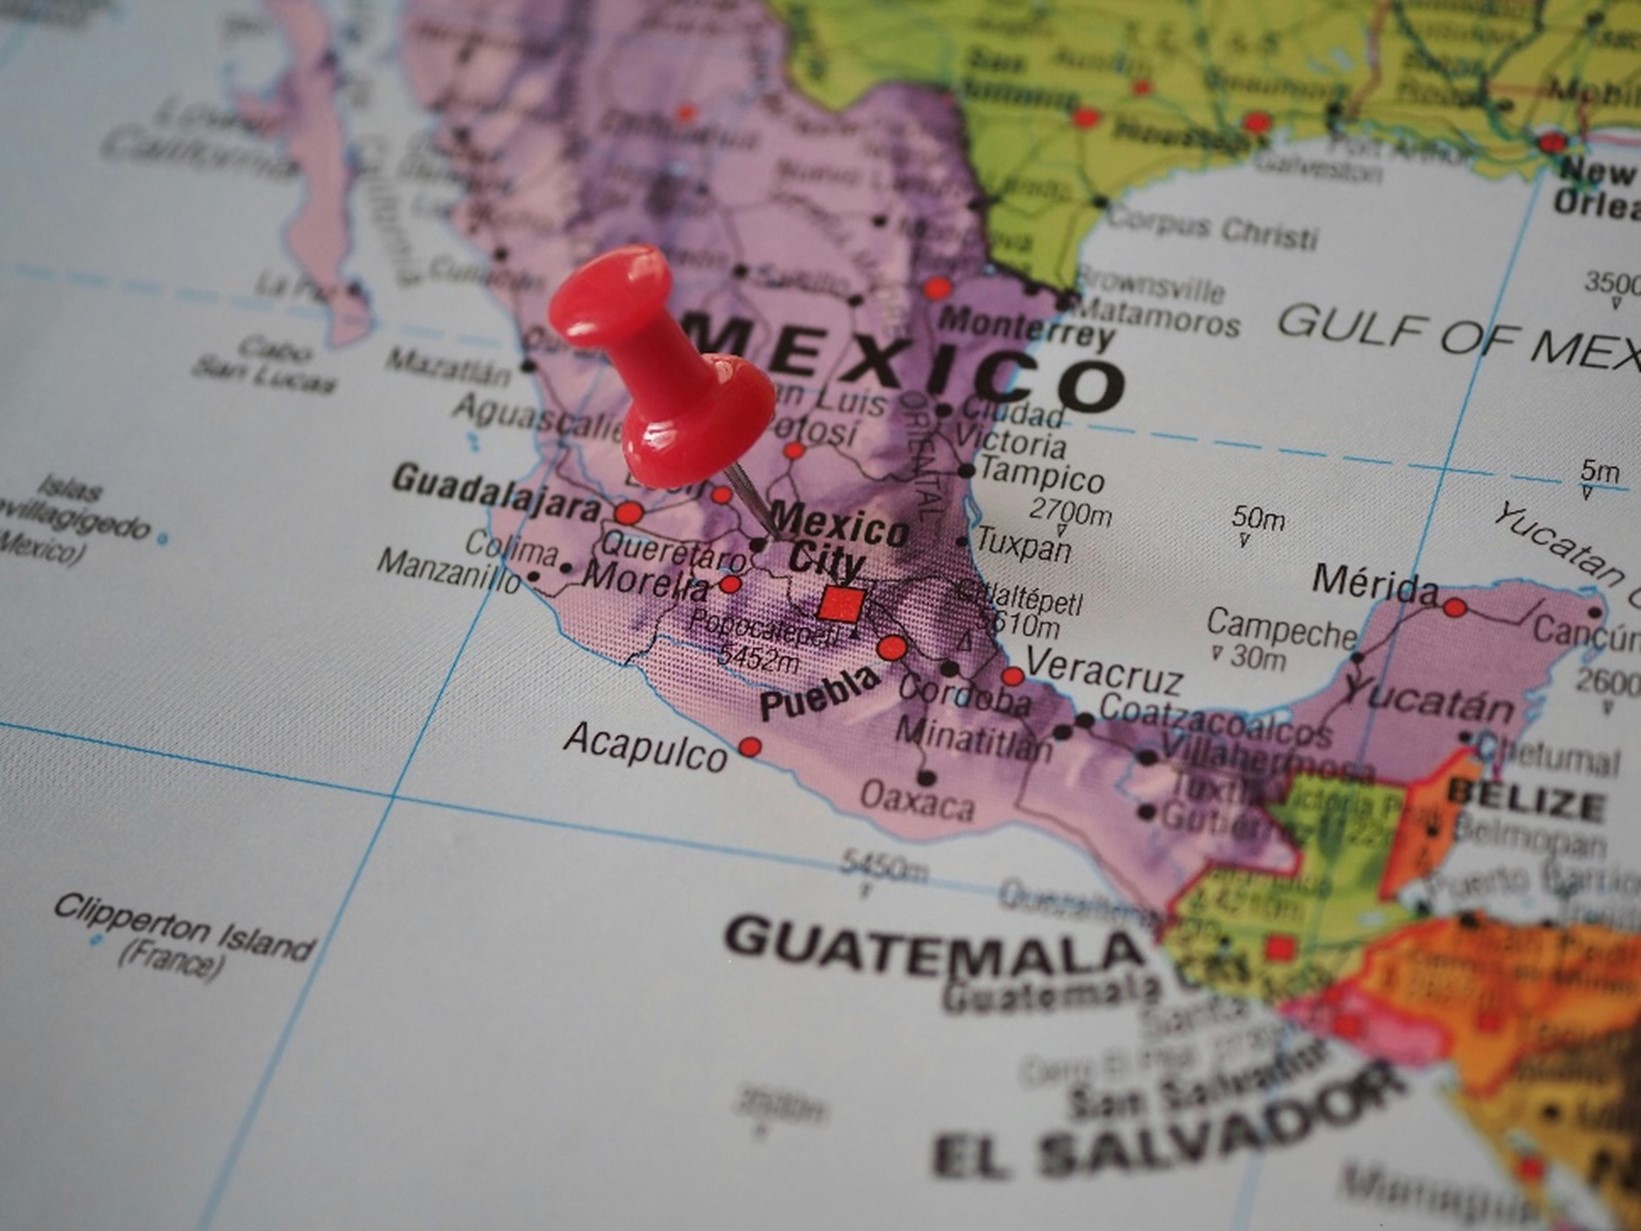
Figure 2. Map of Mexico. Source: Beate Vogl via Pexels.
Researchers focused on nine urban centers in Southern Mexico, including Acapulco, Mérida, Veracruz, Cancún, Tapachula, Villahermosa, Campeche, Iguala, and Coatzacoalcos, chosen for their high historical dengue burden and strategic public health importance.
They studied official health records of confirmed cases of dengue (2008–2020), chikungunya (2015–2016), and Zika (2016) in Mexico. They mapped each case based on the patient’s home address and grouped the data into small geographic areas called AGEBs, which are about 0.2 to 0.7 square kilometers in size.
To find areas where these diseases clustered, they used a statistical method for hotspot spatial analysis called the local Getis-Ord Gi*. This technique helped identify hotspots, meaning places with unusually high numbers of cases. To avoid false positives, they used a strict threshold or filtering criteria (Gi* ≥ 3.71 after applying a Bonferroni correction).
The researchers wanted to find out if the same neighborhoods in Mexico were hotspots for dengue, chikungunya, and Zika. To do this, they used a method called Kendall’s W, which helps measure how similar the patterns of these diseases are across different areas.
To make sure their results were accurate, they checked newer data from 2017 to 2020 to see if the same places still had high numbers of dengue cases over time.
They also looked at whether these hotspots showed up in people of different age groups and tested other ways of mapping the data. This helped confirm that their findings were consistent and could be trusted for future public health planning.
Arbovirus Hotspots in Mexico Are No Coincidence

Figure 3. Wi-Fi hotspot concept. Source: stockvault
The analysis revealed that dengue, chikungunya, and Zika cases were not randomly distributed but instead concentrated in well-defined urban hotspots.
These hotspots occupied about 17.6% of each city’s area, contained approximately 25.6% of the population, but accounted for an outsized 32.1% of reported cases.
There was significant overlap between the different diseases: 61.7% overlap between dengue and Zika hotspots, and 53.3% overlap between dengue and chikungunya hotspots.
Temporal validation showed that dengue hotspots identified from 2008 to 2016 successfully predicted hotspot locations in 2017 to 2020 for five of the nine cities studied.
For example, in Iguala, nearly 50% of cases occurred within 23% of the city’s area, while in Veracruz, 18% of cases were concentrated within 11% of the area.
Merida: A Public Health Success Story
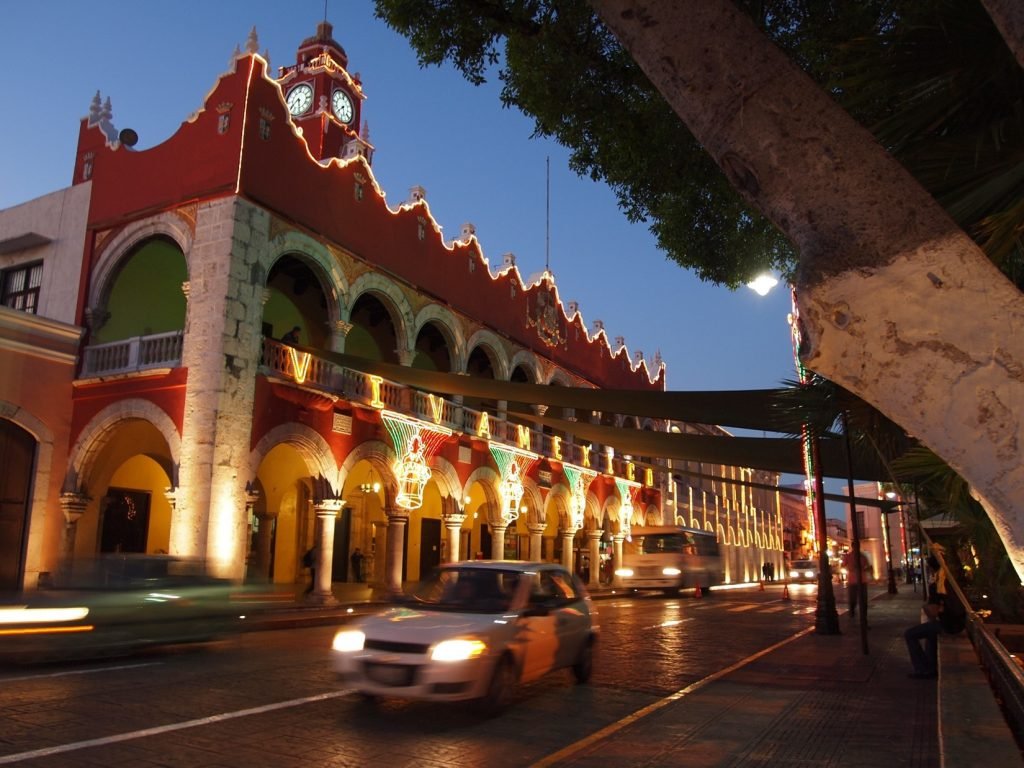
Figure 4. Merida city hall, Mexico. Source: tizzle via Wikimedia Commons.
One of the most compelling outcomes of hotspot mapping comes from Mérida.
There, targeted hotspot surveillance led to the early detection of dengue-3 virus in mosquito populations in 2017. This allowed for rapid public health interventions, including localized spraying and community engagement, which successfully prevented any human dengue-3 cases from emerging .
This proactive approach aligns with the World Health Organization (WHO) and Pan American Health Organization (PAHO) guidelines, which recommend the use of spatial risk stratification to optimize vector control efforts.
Why Dengue Does Not Go Away
Interviews with local vector control teams identified multiple social and environmental drivers of hotspot persistence.
These included inconsistent water supply (leading to water storage practices that create mosquito breeding sites), high crime rates, lack of community trust, and the presence of informal settlements and transient migrant populations.
These factors complicate vector-control efforts and create conditions where Aedes mosquitoes can thrive.
How Hotspot Mapping Shapes Tomorrow’s Public Health

Figure 5. Mexican youth. Source: pxhere.
The study underscores the highly localized nature of Aedes-borne virus transmission in urban areas. By identifying persistent hotspots, public health agencies can prioritize targeted interventions like indoor residual spraying, larviciding, and community education, focusing limited resources where they will have the most impact.
In an era where dengue and other mosquito-borne diseases are escalating across Latin America, this research provides a powerful tool for smarter, more effective control programs that could save both lives and money.
